Intuitive editor for creating synoptic sreens

Graphical presentation of data

As part of the DataPortal account, we offer an intuitive editor for creating vector graphics. All you need to do to build your first screen is arrange the objects on the screen and define their properties. With the help of available animation scripts, you can further enrich and personalize the application.

0 +
Screens
0 +
Datasources
0 K+
Devices
0 K+
Tags
Responsive synoptic screens

Scalable Vector Graphics (SVG)

Graphics in the system remain crisp and scalable despite different resolutions or multiple zooming. The screen is ideally suited to all types of devices, from smartphones to laptops and large screens of large-format graphic walls in dispatch centers

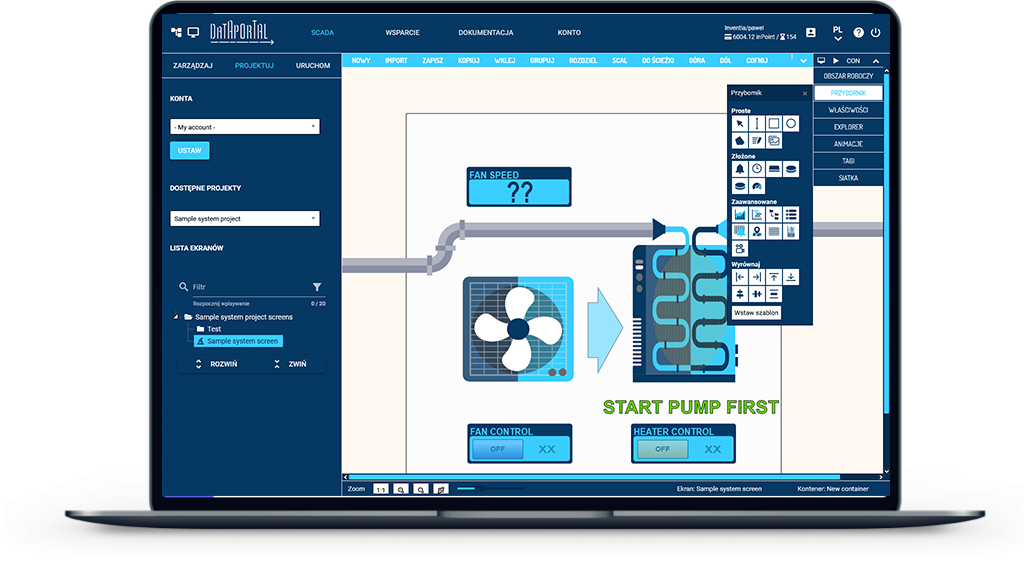
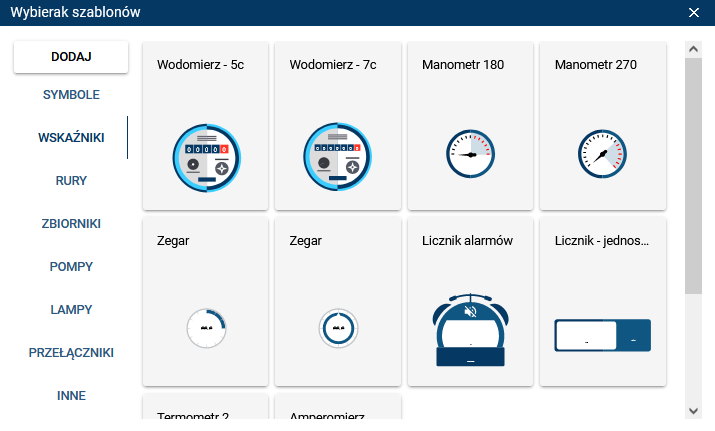
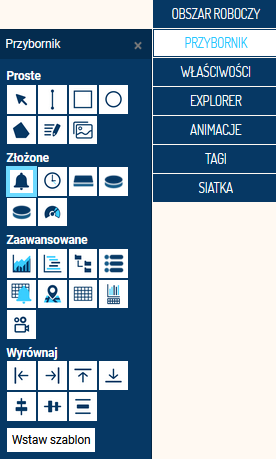
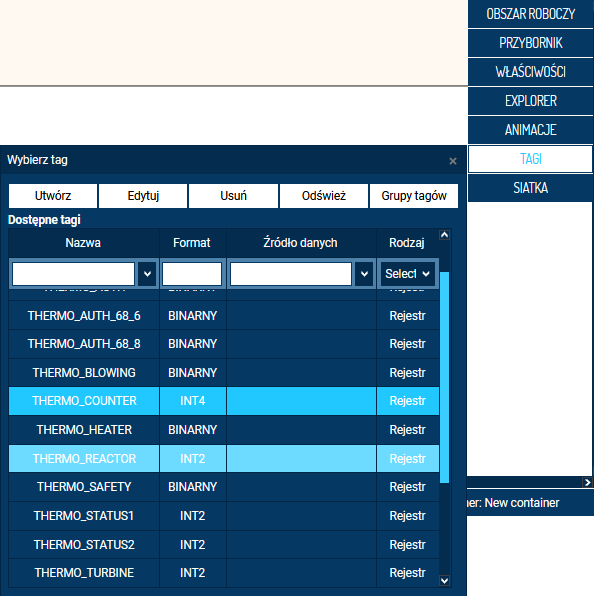
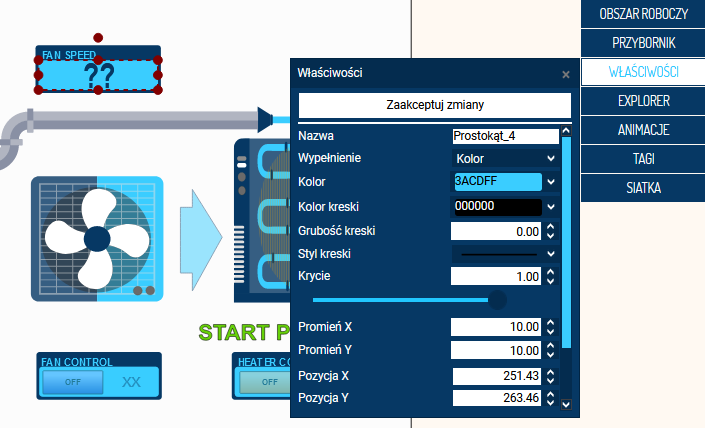
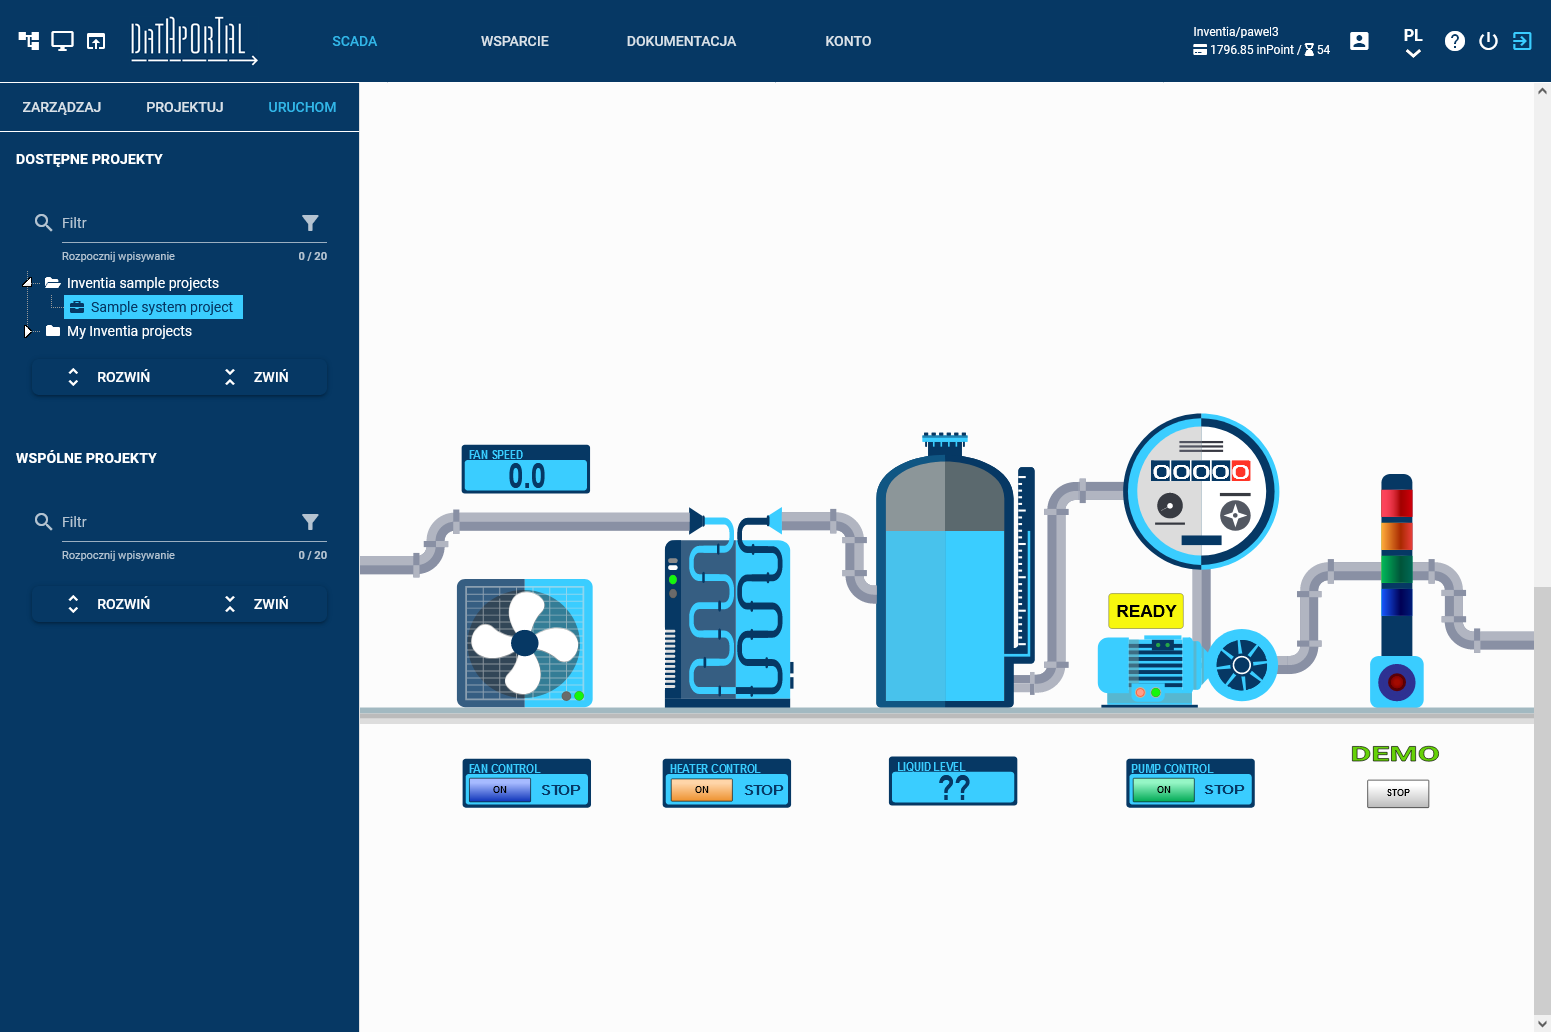
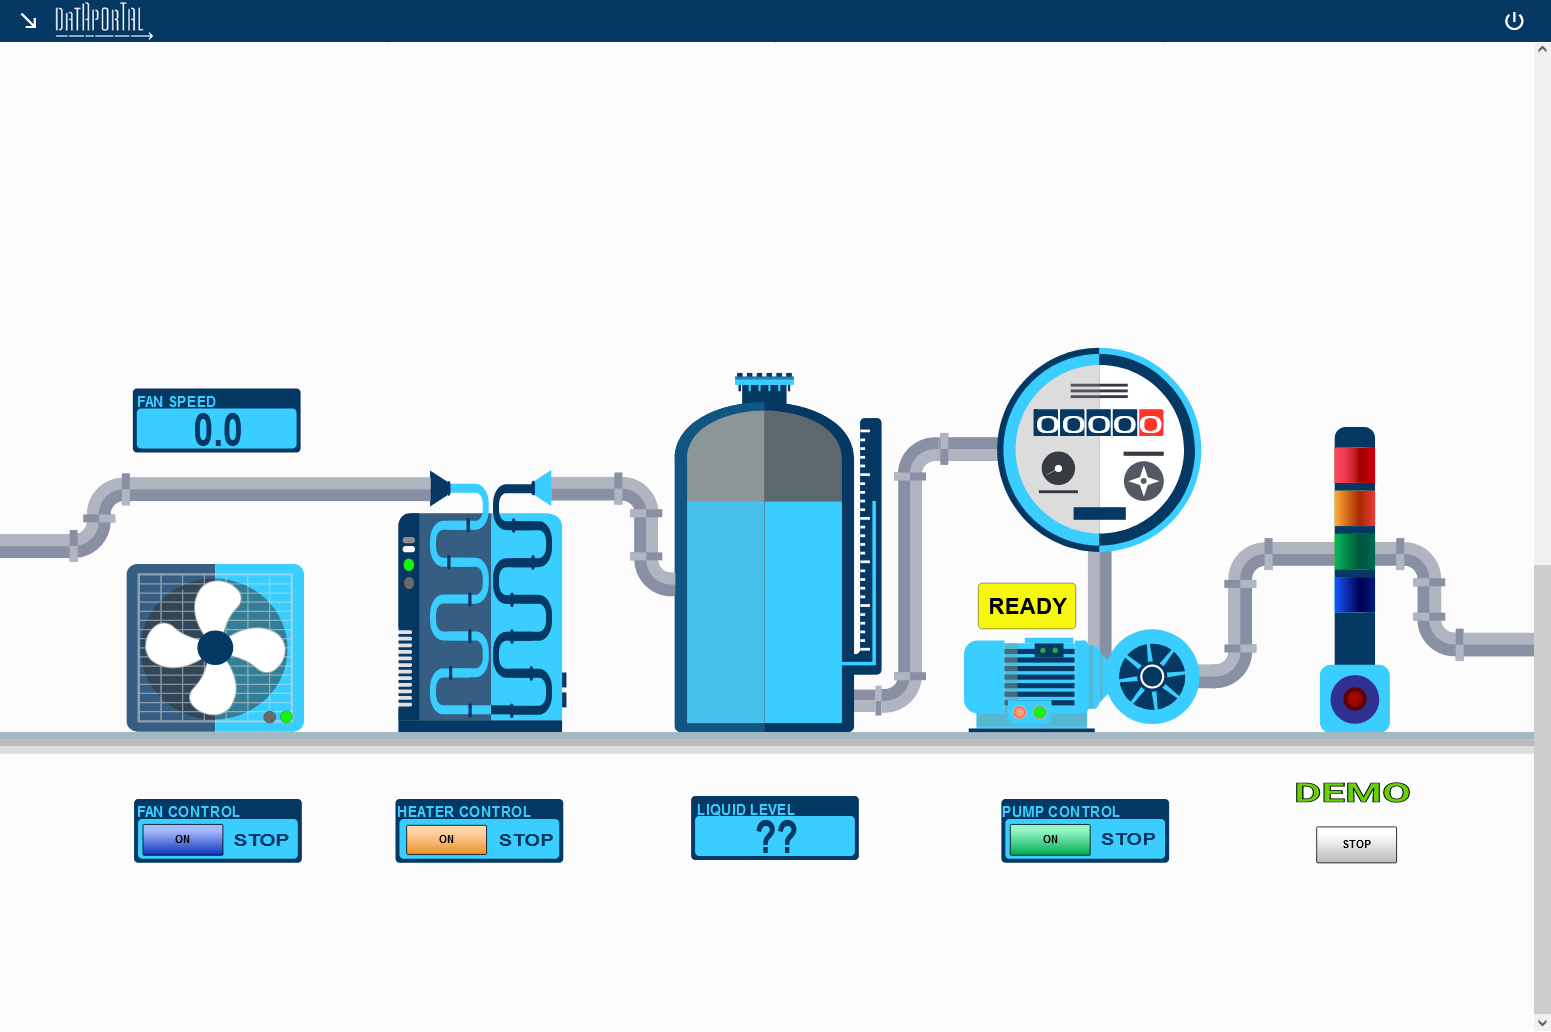
Library of ready-made graphic elements

Don’t you want to spend time designing graphic objects from scratch? Do not worry! Check out our container of ready-made graphic elements! The prepared library consists of commonly used industrial devices, such as tanks, pumps, indicators, valves, lamps, switches, and others. The applied vector format of the objects allows freedom in their possible scaling. You can resize an object to fit your drawing without losing details. Importantly, ready-made elements can coexist with those drawn on your own.

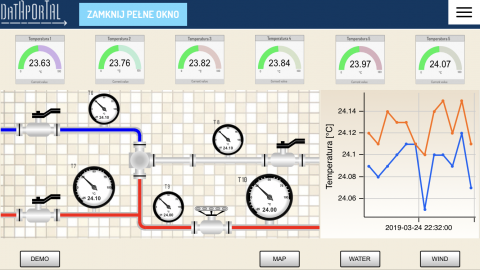
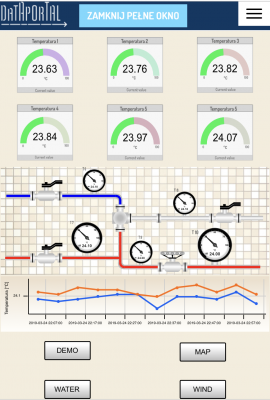
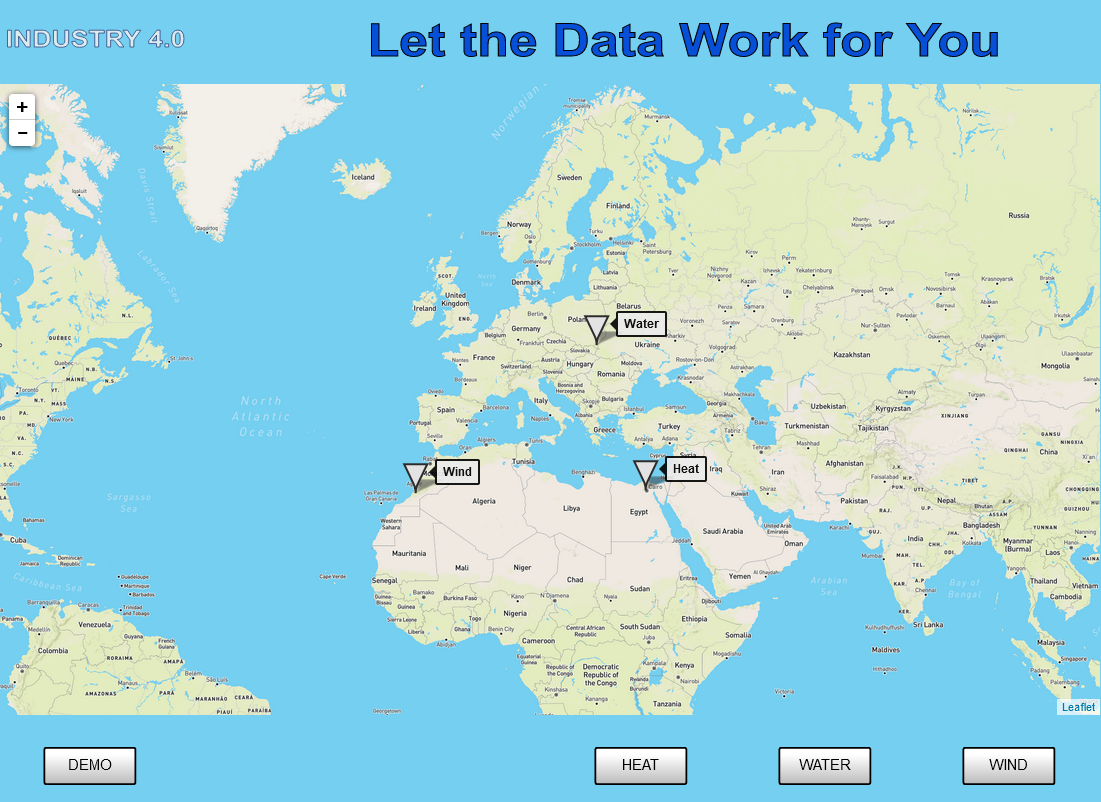
Spatial distribution of objects on the map

DataPortal offers a ready-to-use map control that allows you to build a synoptic screen with the spatial arrangement of objects. The color of each of the map markers, symbolizing a given object in the field, can be individually animated, depending on the value of a single variable or a complex expression. Additionally, you can use a script which, after selecting an object from the map, will allow you to change the presented screen, displaying e.g. details of the object.

Expression generator

DataPortal provides a generator of arithmetic and logical expressions directly when creating a variable calculated with a defined formula. Thanks to this, it is possible to process raw data to extract information useful for the user and present it on the screen.

Advanced visualization wizard

Design mode is the most complex part of DataPortal’s user interface. It is also the area where Account Administrators have access to the list of all screens, always visible for the selected project and with the possibility of grouping them into folders. They can also modify their names and delete them. The main functionality concerns the editing of the screen itself, which takes place in a special application resembling SCADA software, but running in the user’s browser and saving the content in the DataPortal database.

The editor software includes the following functionality:

FAQ

Frequently asked questions

If you did not find the answer to your questions contact us:

E-mail: dataportal@inventia.pl

Tel: +48 502 056 503

No, DataPortal works in any web browser, without the need to install additional applications and plugins. You can also use it on tablets and phones.

It does not matter what operating system we use, as long as we have a web browser installed in it and access to the network.

No, DataPortal has a visual designer in which we only need to know what variables provide which type of data. The rest depends on creativity and the right selection of items from the toolbox.

Yes, DataPortal can be used on the phone, although it mainly concerns resource management or the preview of animation screens. The screen editor itself is such a complex application that it is simply not convenient to use it on the phone, although it is possible.
Yes, DataPortal is a cloud-based system that can be used by many users at the same time. There is no limit to the area of ​​management and design, and account administrators can set limits for simultaneous connections to watch ready-made animations.